If you’ve ever dropped rates on a “slow” date only to watch demand magically appear two days later, you already know the problem.
Most hotel forecasting tools show you a single snapshot, and unfortunately, snapshots lie.
OTB, pickup curves, SPIT — they’re the reports teams have lived on for years. Each tells a story, but none tells the whole story. So you’re left playing demand detective, scrolling through graphs, trying to connect clues that were never designed to line up.
And here’s the twist: it’s not you. It’s the system.
Hotel demand isn’t one-dimensional, but the reports and tech the industry has relied on for decades are.
The hotel demand time surface changes that. It pulls all those scattered signals into one unified view so you can finally see demand as it actually behaves. When you see the full surface, the mystery spikes, last-minute surges, and what happened here? moments, suddenly make sense. And forecasting stops feeling like guesswork and starts becoming a real advantage.
Why one-dimensional forecasting keeps letting hotels down
Here’s the simplest way to think about it: every booking has two clocks running at the same time.
- Stay date — when the guest is actually in-house
- Lead time — how far in advance the booking happened
Together, these two clocks form the shape of your demand. But most hotel reports only look at one at a time. They either track when people are staying or when they booked, never both together. That’s what we mean by one-dimensional forecasting.
It’s like trying to understand a whole story by reading every other page. Sure, you get pieces, but you also end up filling in the gaps without the data to back it up.
And when revenue depends on precision, it gets very expensive.
Below, we break down the three most common metrics revenue managers rely on and the blind spots they create when used in isolation.
Rooms on the Books (OTB)
OTB is the old faithful. It tells you how many rooms are booked for future dates right now. It helps you spot weak dates, strong dates, and where pricing might need a nudge.
But OTB is just a moment in time. Booking pace behaves differently for:
- Weekdays vs. weekends
- Holiday periods vs. shoulder nights
- Leisure vs. business
- High-season vs. low-season
Some dates fill up fast and level off. Others crawl until the last ten days and then explode. A date that looks “concerning” today may still be perfectly normal, just a slow starter.
Drop rates too early on a naturally late-booking date and you’re not optimizing, but you’re discounting against your own demand curve.
Same-Point-in-Time (SPIT)
SPIT reports try to level things out by comparing all stay dates at the same lead time, for example, showing everything at exactly 21 days out. In theory, this removes lead-time bias and gives you a cleaner comparison.
In practice, lead time affects every date differently. A Saturday in August behaves nothing like a Tuesday in February. High-demand dates still look strong at long lead times, while low-demand dates may not move until much closer to arrival. SPIT helps reduce noise, but it can still mislead you when different types of demand patterns share the same 21-day snapshot.
Pickup curves
Pickup curves offer the opposite perspective. Instead of fixing the lead time, they fix the stay date and show how bookings accumulate as check-in approaches. They’re helpful for spotting last-minute softness or identifying where surges typically occur.
But they only tell you how one date is performing, without any context from the dates around it. If June 30 (a Sunday) shows sluggish pickup, lowering rates might feel like the right move — unless you notice that June 28 and 29 (Friday and Saturday) are pacing extremely well at higher rates. In that case, dropping Sunday’s price could unintentionally undercut the value of the entire weekend.
Pickup curves, like OTB and SPIT, highlight important signals. They just do so in isolation, which means it’s easy to misread the bigger picture.
The missing piece
The problem isn’t that these reports are wrong. It’s that each one only shows a slice of what’s happening.
Rooms on the Book Graph, SPIT graph and pickup curves are intersections of the Hotel Time Surface at fixed report date, fixed lead time, and fixed stay date, respectively. As a result, most existing literature focusing on forecasting the above graphs neglect an extra dimension of information available for prediction.
Demand isn’t one-dimensional, and neither are guest behaviors. But for decades, hotel systems haven’t been structured to capture both timelines in a unified way. Even many modern machine learning models still treat each stay date on its own, which means they miss how demand on one date influences surrounding dates.
The data model that changes everything.
Go deeper into time surfaces and the model behind today’s most accurate predictions.
The accuracy vs manageability conundrum
A revenue manager aware of the limits of these metrics might try to compensate by pulling daily reports to track every evolution of demand. But after two weeks, they’d be staring at 14 overlapping graphs with nearly identical lines—impossible to interpret, let alone act on.
Alternatively, they could make data analysis more manageable by switching to weekly reports, but they would also risk missing important shifts happening between snapshots. Either way, one-dimensional reports force a trade-off between accuracy and usability, leaving revenue managers making decisions without the full picture.
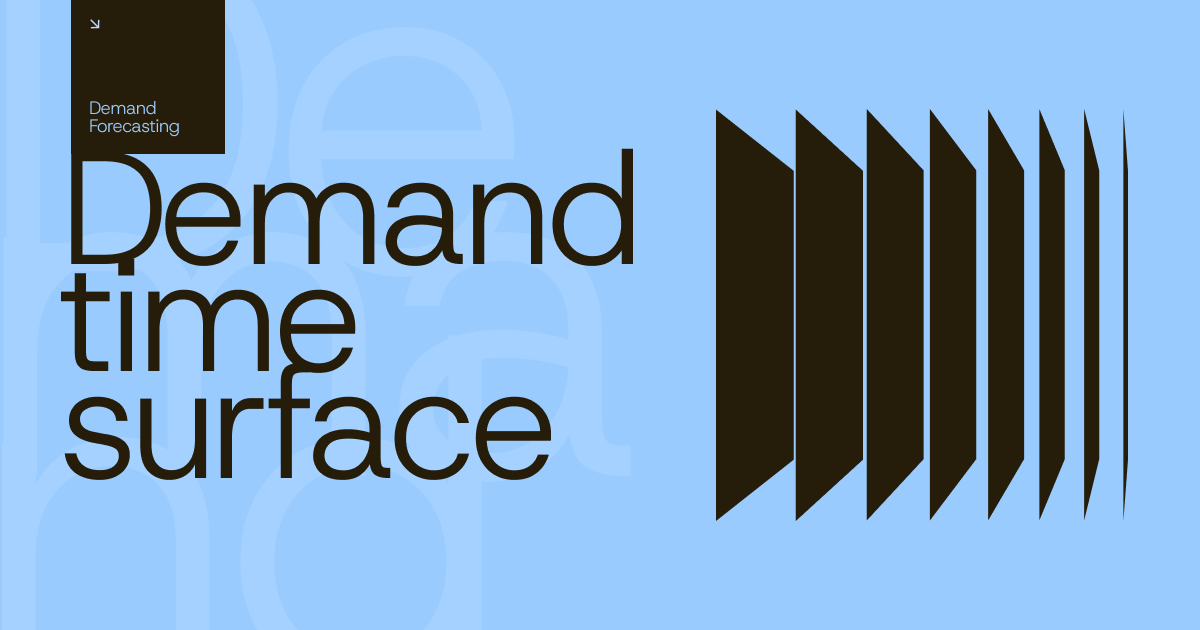
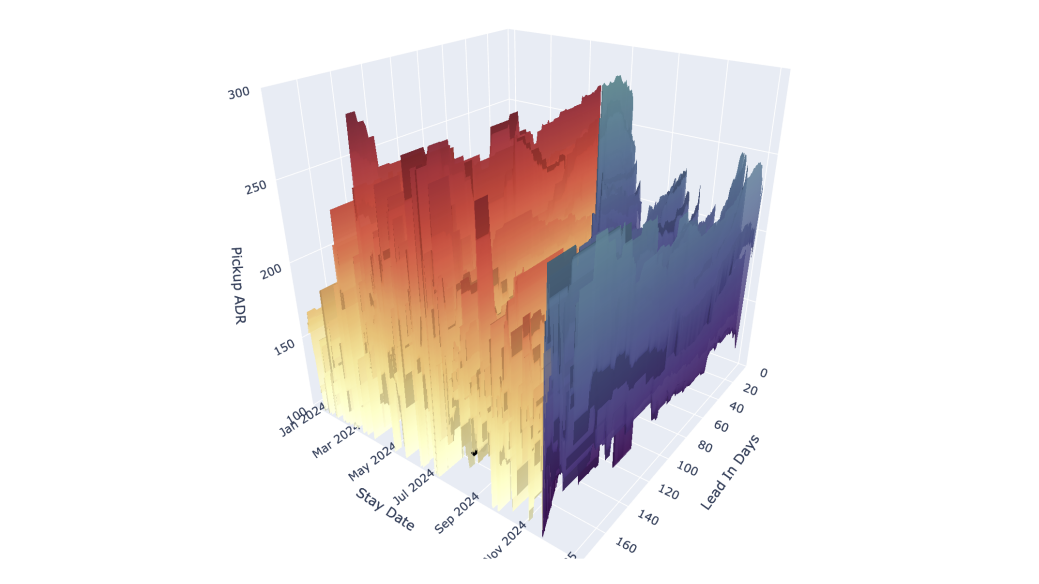
What is a hotel demand time surface?
The hotel demand time surface finally removes that trade-off. Instead of forcing you to choose between moments, it gives you the entire story of how demand builds, shifts, and reacts over time.
At its core, a time surface is a two-dimensional view of your booking data, with one axis for stay date and the other for lead time. When those two timelines come together, every report you already know (OTB, SPIT, pickup curves) is revealed as a single slice of a much richer, more complete picture.
Visually, imagine a 3D map where:
- The height of the surface shows the number of rooms booked
- The color intensity shows booking strength, and
- The shape of the surface reveals how demand actually evolved, not just where it ended up.
Suddenly, you see not only where bookings stand today, but how they got there and what that trajectory tells you about tomorrow.
How Cloudbeds turned theory into better forecasting
Seeing the full demand surface is powerful, but making it usable every day is where the real breakthrough happens. Cloudbeds didn’t just map the time surface; we built a forecasting engine that can actually learn from it and help hoteliers make smarter decisions in real time.
During Passport, Amit Popat, Head of Machine Learning at Cloudbeds, explained how our forecasting model is different.
See the difference.
Our Head of ML explains how Signals turns a snapshot into a moving picture of demand.
Here’s how the model behind Cloudbeds Revenue Intelligence turns a complex, two-dimensional world into clear, confident action.
1. Multiple time surfaces
Demand isn’t just about how many rooms get booked; it’s shaped by what you charge, competitor rates, and how guests respond along the way. So instead of using a single surface, Cloudbeds creates parallel surfaces for:
- Rooms on the books
- ADR
- Your rates
- Competitor rates
- And much more
All of them are tracked across the exact same stay-date × lead-time grid, which means the model can “see” how pricing pressure, discounts, or competitor changes influence booking momentum day by day.
2. A unified dataset built for forecasting
Raw surfaces on their own are powerful, but they become transformational when structured into a clean, unified dataset — a time-series panel. Each row represents a specific moment in the demand landscape (a stay date at a particular lead time). Each column captures real-world factors like:
- Holidays and events
- Day-of-week patterns
- Seasonality
- Pricing differences between you and your competitors
The messy complexity of hotel demand suddenly becomes clean, aligned, and ready to learn from.
This has led us on a journey to amass one of the largest collections of hospitality data out there. I’m talking about over forty different signals, such as hotels’ forward-looking booking data, we’ve got booking searches, we’ve got competitor prices. We’ve got events. This is just to name a few. In fact, we’re processing over four billion hospitality data points per hour.
3. Cloudbeds’ proprietary AI ensemble
This is where the magic happens. Our panelled ensemble AI looks across all surfaces simultaneously to understand how demand behaves in context, instead of as isolated slices.
It learns relationships like:
- How early weak demand affects late-stage booking velocity
- How competitor pricing influences pickup curves
- How a rate increase on one date affects nearby dates
- When a dip in demand is normal and when it’s a red flag
For example, if bookings for April 15 suddenly slow after competitors drop their rates by 20%, the model may recommend holding firm instead of discounting, protecting RevPAR without panicking at a single data point.
What Cloudbeds Revenue Intelligence means for hotels
Cloudbeds is changing everything about revenue management for hotels, including:
More accurate forecasting
As outlined in our demand forecasting whitepaper, our model consistently outperformed traditional one-dimensional methods — SARIMA, Prophet, XGBoost, and neural networks — across every time horizon.
Across thousands of forecasted stay dates, Cloudbeds achieved:
- Up to 65% lower MAE
- Over 50% lower MAPE
- Far greater stability at long lead times
Even hotels with sparse bookings — the ones forecasting models traditionally struggle with — saw major improvements.
And the incredible thing is we’re seeing the results. We’re achieving up to 95% forecast accuracy over the three-month window. We’ve even reached up to 97% for some properties.
Better pricing decisions
When your forecasts stop shaking, your pricing strategy stops too. In simulation tests, hotels using the Cloudbeds model saw an:
8.4% revenue uplift compared to taking no action vs. ~3% with traditional forecasting models.
Optimized operations
When you can trust your forecasts, every department benefits.
- Housekeeping can schedule around projected occupancy.
- F&B can plan orders without overbuying or under-stocking.
- Maintenance can avoid peak turnover days.
Stronger marketing alignment
Forecasting helps hotels go beyond rates by choosing the right commercial levers.
If the demand surface shows a slowdown and the rate surface shows you’ve already dropped prices, the issue isn’t pricing; it’s visibility. That’s when targeted marketing, not deeper discounts, becomes the smarter move.
Marketers get clarity, revenue managers get context, and ownership sees tighter alignment across the commercial team.
Forecasting with confidence
Forecasting has never been about charts or curves — it’s been about confidence. Confidence to hold rates when it feels risky. Confidence to staff up before the rush. Confidence to push marketing instead of discounting. For years, that confidence was hard to come by because hotels were working with incomplete views of demand.
The hotel demand time surface changes that. By treating booking data as a true two-dimensional system — stay dates and lead times moving together — Cloudbeds gives hotels a forecasting foundation that finally matches the way demand actually behaves. No more choosing between accuracy and usability. No more guessing why the data shifted overnight.
And while the science behind this model is complex, using it isn’t. Cloudbeds Revenue Intelligence and Signals translate all of that math into simple, clear forecasts and recommendations hoteliers can act on immediately. The technology is here, it’s battle-tested, and it’s already reshaping how ambitious hotels price, plan, and operate.
If your reports feel incomplete, they are.
See how Cloudbeds fills in the missing dimension.