
Revenue managers don’t need another lecture about forecasting metrics. You already live inside these numbers day in and day out. They’re the pulse checks you run before your first cup of coffee.
But here’s the frustrating part: even when you’re staring at all the right metrics, the picture still feels incomplete. Pickup velocity can look strong one week and vanish the next, and a “healthy” SPIT report has a way of turning into a surprise slump when it’s too late to adjust.
It’s not because you’re reading the metrics wrong. It’s because the industry has asked revenue managers to forecast a two-dimensional problem with one-dimensional tools.
As Dr. Terence Tsui, Senior Data Scientist at Cloudbeds, explains in his demand forecasting whitepaper, reports like OTB or pickup curves “are one-dimensional slices of a richer two-dimensional surface” — a surface that captures how bookings actually build across both stay dates and lead times.
That surface is finally visible. Technology now makes it possible to connect these dimensions, revealing patterns static reports can’t capture: momentum that accelerates or collapses, rate changes that ripple through booking windows, and how demand on one day quietly influences the days around it.
In this article, we’ll revisit the core forecasting metrics hotels already use and show how viewing them through the lens of the hotel demand surface transforms them from snapshots into genuine decision-making signals.
Want the research behind this approach?
See the technical study that breaks down the hotel demand surface.
Core forecasting metrics
Let’s start with the metrics revenue managers rely on every day.
Rooms on the books (OTB)
Rooms on the books is the total number of rooms booked for a future stay date at the moment the report is pulled. It’s often the first place revenue managers look, helping teams understand where demand stands right now.
OTB helps identify strong dates that may support higher rates, as well as softer dates that might need sales activity or promotions. The challenge is that OTB is just a snapshot — it can’t show how demand will evolve.
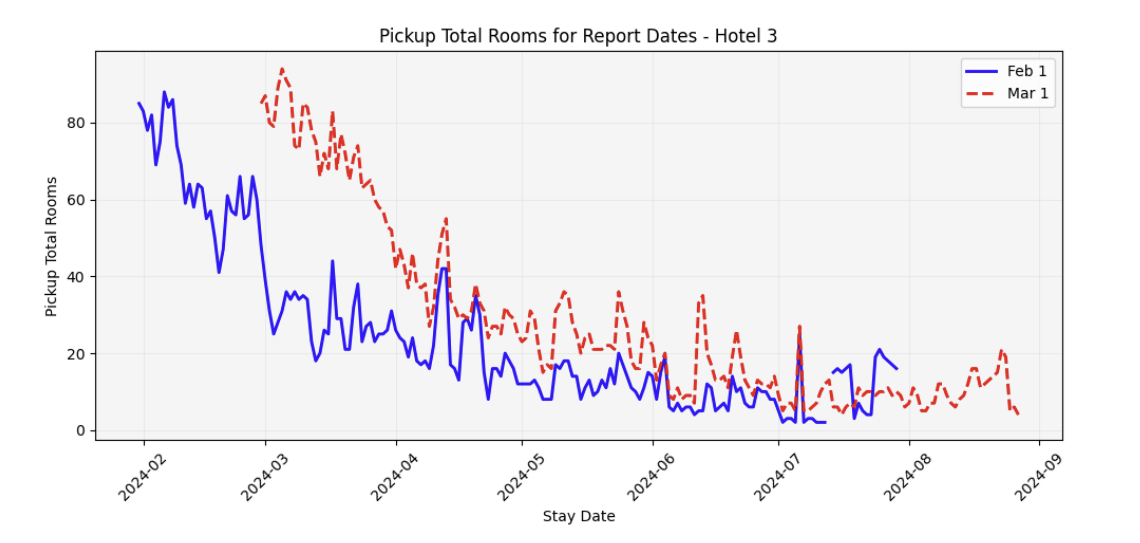
For example, in the OTB report below, the blue line shows booked rooms as of Feb 1 for the six following months. Two stay dates in April stand out as strong, even though they’re still more than two months away. But a single snapshot can’t show how demand will evolve. The updated OTB report one month later (red dashed line) makes this clear. The later April date gained very few extra bookings, while the earlier one continued to build momentum.
Pickup curves
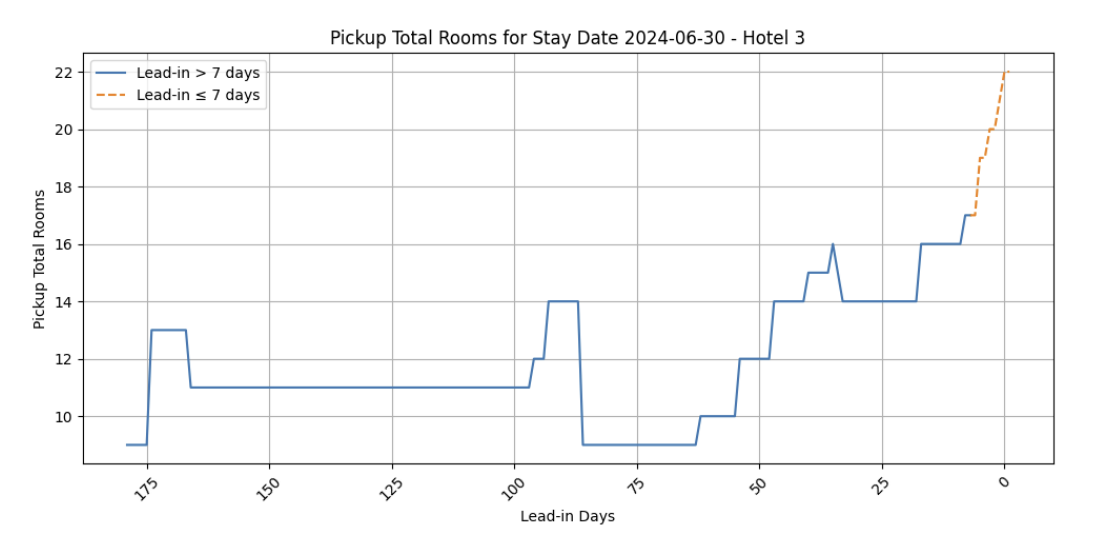
Pickup curves track how bookings accumulate as the stay date approaches. They’re often used to forecast short-term demand: the idea is that by analyzing booking pace up to, say, 7 days out (as in the example below), revenue managers can anticipate the pace for the final stretch and adjust pricing accordingly.
But while pickup curves capture how demand evolves for a single date, they ignore what’s happening on surrounding dates or how the same day behaves across different weeks. As a result, they can still distort forecasts.
Same-point-in-time (SPIT) comparison
SPIT reports fix the lead time so all dates can be compared equally. For instance, a 21-day SPIT report shows what every date looks like exactly 21 days before arrival. The goal is to reduce lead-time bias since close-in dates naturally appear stronger.
SPIT helps create apples-to-apples comparisons, but it still relies on a single cut-off point — and not every date behaves similarly at the same lead time. Some dates pick up early. Others barely move until the last 72 hours. A single SPIT snapshot can easily miss that nuance.
Average daily rate
ADR represents total room revenue divided by rooms sold. It’s one of the most referenced commercial metrics because it signals pricing power — how much guests are willing to pay on a given date.
But ADR on its own can be misleading. A high ADR doesn’t necessarily mean strong performance if it comes at the cost of occupancy. The real value comes from understanding how ADR interacts with demand patterns across both stay dates and lead times.
Revenue per available room
RevPAR is often treated as the ultimate performance metric, the scoreboard that tells leaders how well a property is monetizing its rooms.
Traditionally, RevPAR is reviewed after the fact. But forecasting reframes RevPAR as something you can shape in advance. When ADR and occupancy curves are evaluated together, teams can project likely outcomes and adjust strategy before revenue is left on the table.
From slices to the full picture
In the hotel demand surface, all these metrics come together in a single 3D view that links every booking to its stay date and lead time. This unified picture shows not just where demand stands, but how it evolves, which dates surge early and then flatten, and which ones stay quiet until the last minute before surging.
Here’s how those same metrics behave differently when viewed through the demand surface:
A SPIT report may suggest strong demand for a certain date, but the demand surface shows momentum tapering off about 10 days before arrival. In that case, rather than keeping rates high, launching a targeted package drives better results.
A traditional OTB might show a lagging date and prompt a panic discount. The unified model, however, reveals that this date usually picks up late, so holding rates is the smarter move.
A pickup curve could make a date look healthy with strong early bookings, but the unified model shows the curve flattening before capacity is reached, as guests shift to other dates. With that insight, the commercial team can launch a mid-lead promotion ahead of competitors.
Stop accepting 20% forecast errors
For years, hotels have been told that a 15–20% forecasting error is “normal.” And revenue teams have learned to live with it — adjusting rates cautiously, second-guessing pace reports, and dealing with last-minute surprises when reality refuses to match the spreadsheet.
But a 20% error isn’t “good enough” when revenue is on the line.
Cloudbeds Revenue Intelligence’s forecasting model, built on the hotel demand surface, delivers much higher accuracy. We tested the model on a diverse set of properties—from busy city-center hotels to smaller rural and resort locations—and compared the results against common forecasting methods.
Cloudbeds consistently performed better across three standard evaluation metrics:
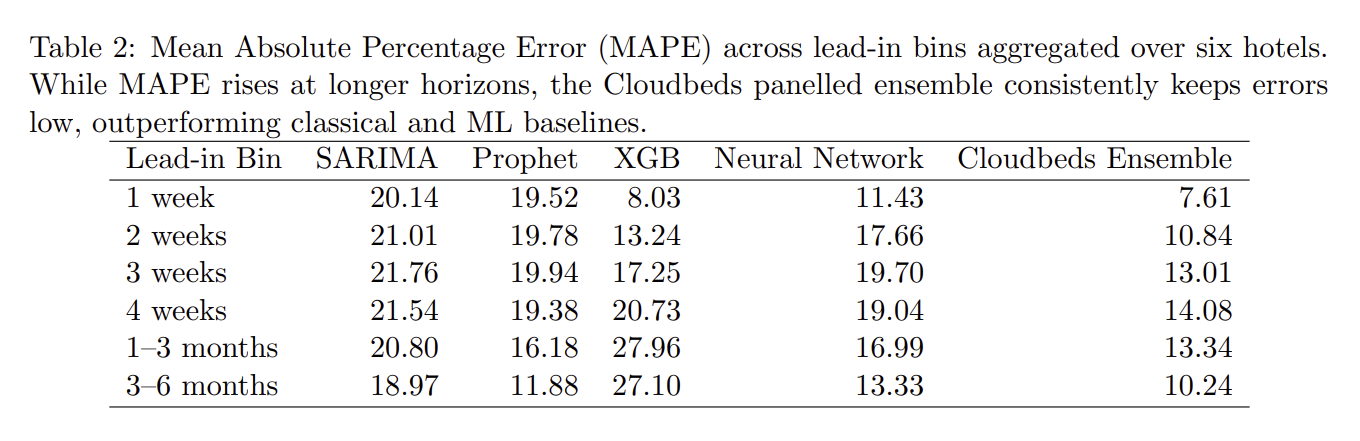
Mean Absolute Percentage Error (MAPE)
MAPE shows the average percentage difference between forecasted and actual values. Lower MAPE means higher accuracy.
For example, if 50 rooms were sold but the forecast was 45, the 5-room gap equals a 10% MAPE. Because it’s absolute, the error is the same in the other direction (forecast 55, actual 50).
Mean Absolute Error (MAE)
Measures the average difference in actual room numbers rather than percentages. This is useful because percentages can be misleading. If a hotel sold 10 rooms but forecasted 11, the MAPE would be 10%, but in absolute terms, the error is just one room.
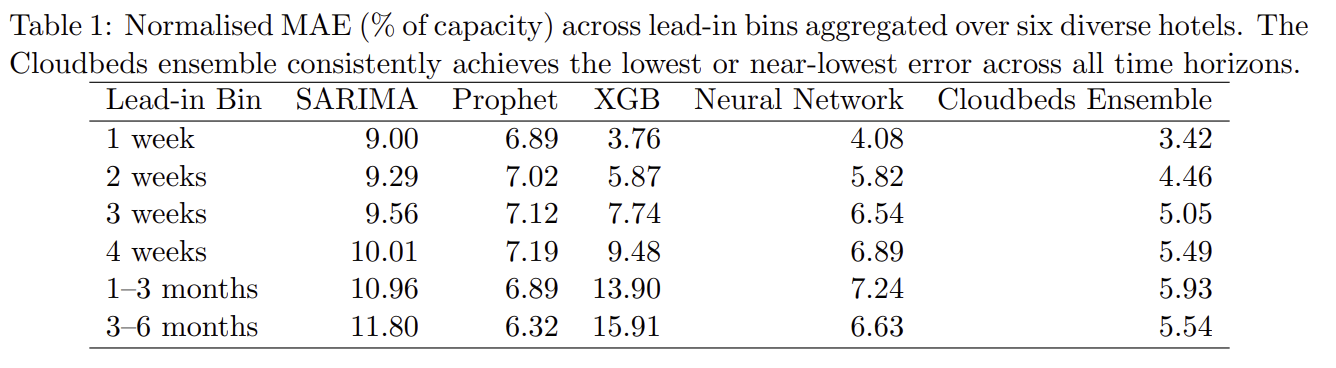
MAE over Room Capacity
Normalizes the MAE relative to the hotel’s size, providing better context and allowing comparisons across properties. For example, a MAE of 5 rooms in a 100-room hotel equals 5%, while the same MAE in a 40-room hotel equals 12.5%.
These results validate the utility of our two-dimensional modelling approach, which jointly captures both stay-date and report-date effects. Its robustness across short- and long-range horizons highlights its suitability for deployment in dynamic pricing, inventory management, and revenue forecasting tasks in real-world hotel operations.
Forecasting that speaks for itself.
Explore real results, accuracy benchmarks, and side-by-side model comparisons.
No more compromising
Traditional forecasting metrics aren’t the issue — it’s what hotels have been forced to do with them. Treating them as separate signals, trying to stitch together a complete story with incomplete tools.
Cloudbeds Revenue Intelligence changes things.
Powered by Signals, the model analyzes billions of data points across stay dates, lead times, rate dynamics, seasonality, and competitor behavior to understand why demand shifts — not just how. Instead of relying on snapshots, it models the full demand surface and reveals the drivers behind every curve, spike, stall, and pacing anomaly.
The commercial impact
Cloudbeds Revenue Intelligence achieves up to 95% forecast accuracy over 90 days, outperforming traditional methods. When you combine that level of accuracy with automated actions across marketing, hotels unlock real commercial gains — including an 18% revenue lift even in the slowest months, because teams can finally hold rate with confidence, catch momentum shifts earlier, and deploy promotions with precision.
With Cloudbeds Revenue Intelligence, OTB becomes a dynamic signal, not a static alarm bell. SPIT becomes context, not a guess. Pickup curves become predictors, not puzzles. ADR and RevPAR become targets you can shape — not outcomes you discover too late.
Don’t settle for 20% errors.
See how Cloudbeds Revenue Intelligence upgrades forecasting accuracy.


